All Activity
- Past hour
-
One of our other departments is discontinuing the use of their Comet L3D2 and I have the chance to upgrade from my ATOS unit. I have experience with GOM Inspect but zero experience with Calypso. Is it possible to capture data with the Comet through GOM inspect 2019?
-
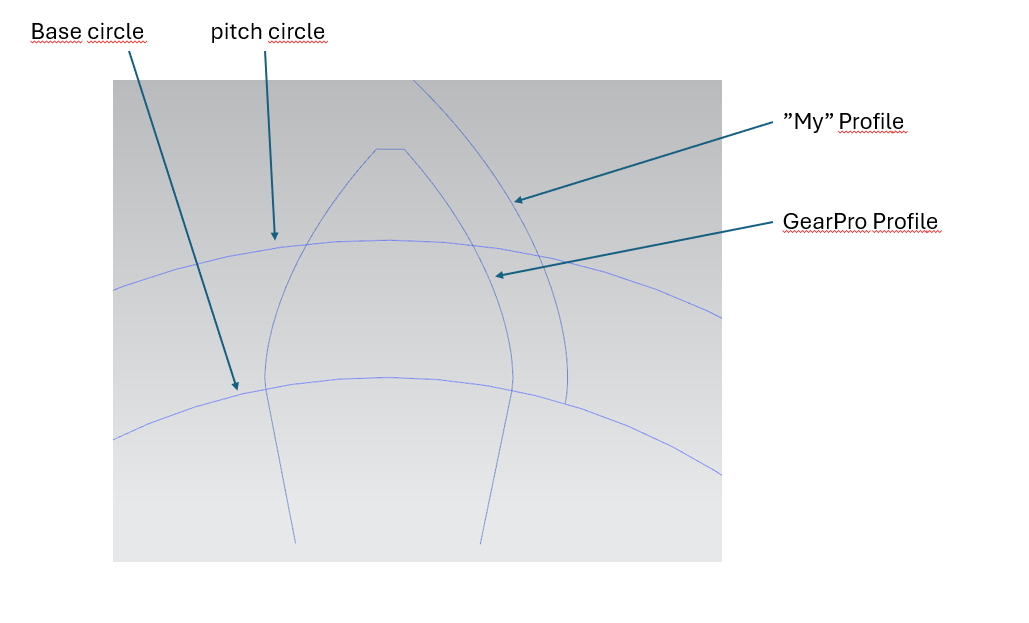
Also instead of Add Mod try using the DOP or tooth thickness in Gear Pro from the print value. I have seen Add Mod incorrect may times on a drawing, wrong sign or too many decimal places or X but should be Xm, etc.
-
I think in most cases yes, as long as data is input correctly (including addendum mod., etc) especially in the newer Nx engine. I've used it for gear and spline cad modeling as well. I think it uses the generated involute & CAD for measuring the nominal, so it would have to be correct per the specs (ISO/AGMA, etc). You can also output to Calypso and take a slice at any height, and output the 2d curve points pop into excel, etc for a comparison, which it looks like you may have already done. Roman should be able to provide further info.
-
 [Tr...] joined the community
 - Today
-
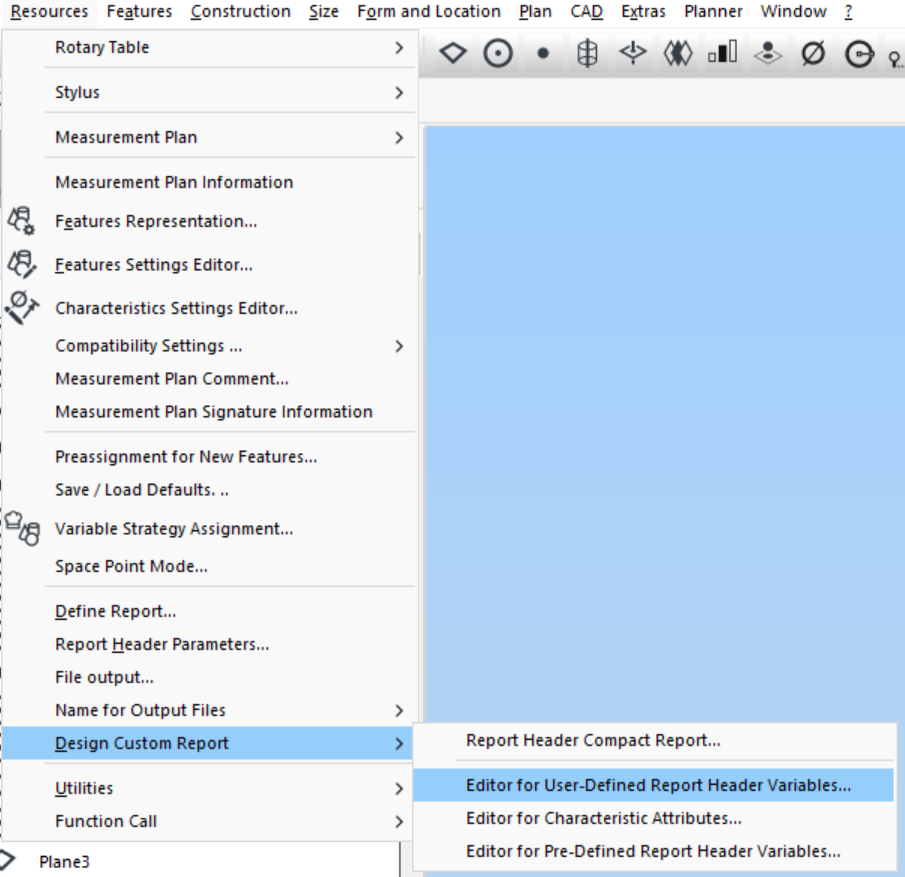
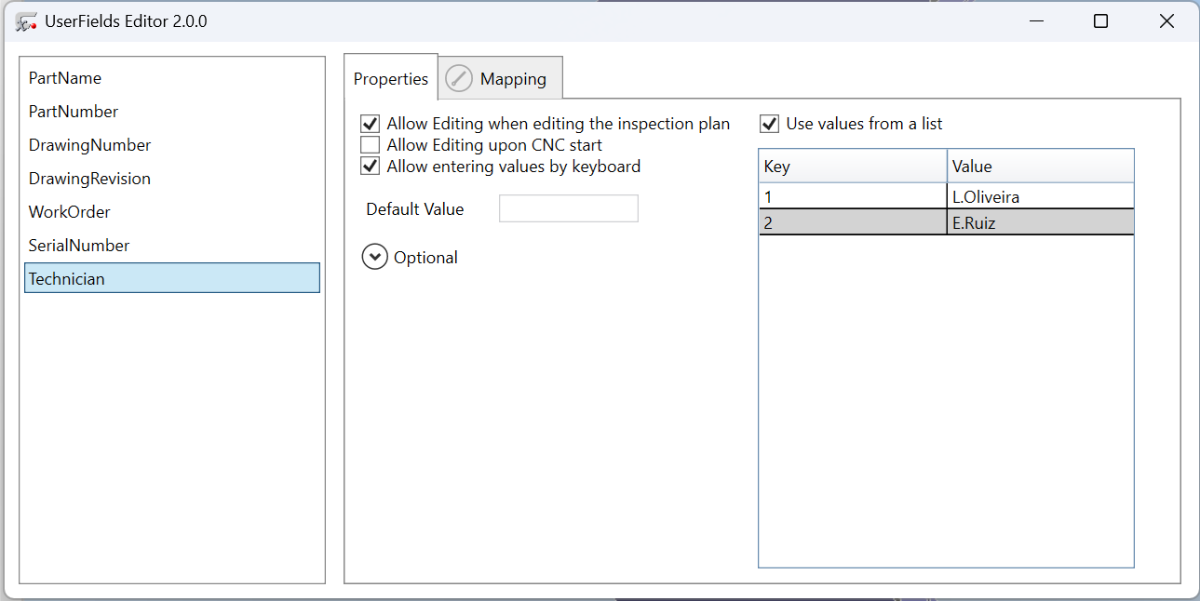
u can edit on calypso check the pictures

-
2nd Edit: It actually seems to just be wrong sometimes, even when completing a new run. Maybe it bugs out when placing in the post settings of the characteristic in question?
-
[Et...] joined the community
-
Import CAD file (step format) retain point names from step file
[Jo...] replied to [Jo...] 's topic in General
Hello, And the PMI module is an additional license? And maybe I have to change also the workflow at our CAD side. Johnny -
[Jo...] joined the community
-
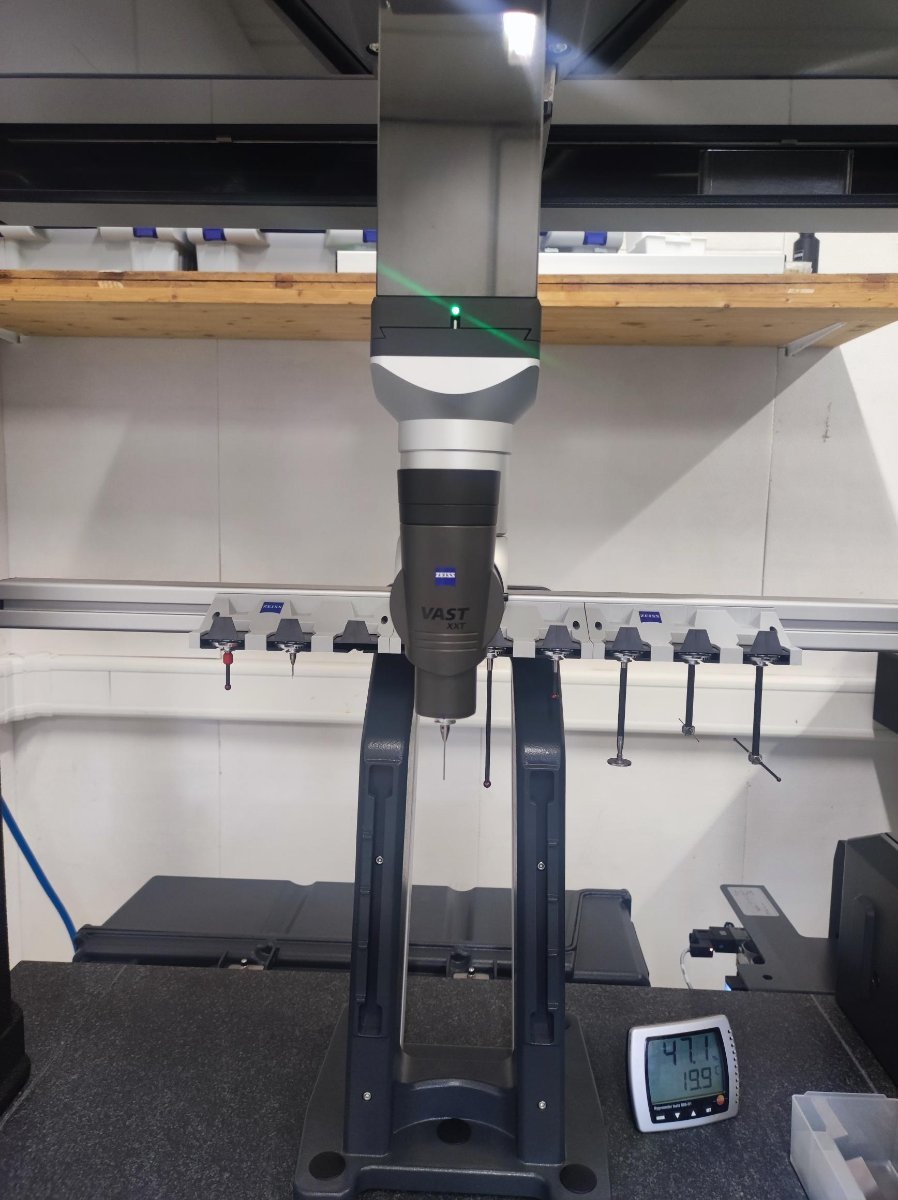
Hi guys, I'm working with a brand-new Contura 700/1000/600 machine. We purchased it with the new RDS VAST XXT TL3 shorter head. Does anyone know the accuracy of the CAA function? I already have quite a few angular positions configured with different styli. I was thinking about using the CAA function to reduce calibration time, but I read somewhere that the accuracy with CAA isn't particularly good. I've already asked Zeiss France, but no one seems to know the actual accuracy. Some people told me it's around 0.1–0.2 mm, while others mentioned 0.05 mm. Does anyone have any information or experience with the RC-CAA function? luis
-
Hello. I just put the right angles for the calibration sphere. The technician used 135/45 with the original sphere. But, as I have a lot of probes, in my program I use another sphere. It'svertical, so angles are 180/0. Problem of SDO-1105 solved. Best Regards from Belgium.
-
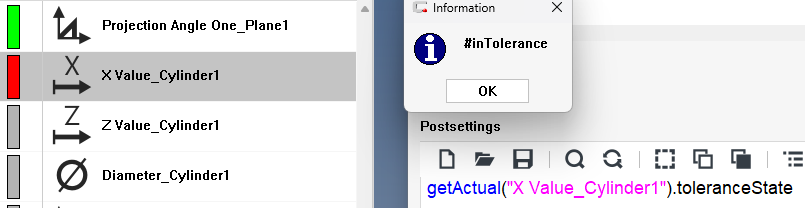
Edit: It seems like the calculation only occurs after an entire CNC run with clear existing results is checked. If you rerun just the feature or update the tolerance, the tolerance state does not update. If anyone happens to know the exact parameters of the triggering of the calculation, I'd really appreciate it.
-
In the post settings of the characteristic.
-

Import CAD file (step format) retain point names from step file
[Ma...] replied to [Jo...] 's topic in General
Hi, like @Richard Stanich said, this could only be done with PMI, we do not convert "Entity Names" in the CAD Conversion. That would be a whole you requirement for CALYPSO. Best Regards Marcel -
This one works without crashing Notepad ++.
-

Import CAD file (step format) retain point names from step file
[Ri...] replied to [Jo...] 's topic in General
Sounds like PMI. Your step file has to be a specific version for PMI and if it is that version, once the file is opened you get an extra Tab next to Features Tab for PMI. STEP AP242 (ISO 10303-242) -
[Ji...] joined the community
-
Hello I'm trying to create a parameterized model in my CAD-software to create involute gears and splines. Since I'm not an expert in the beatiful world of gear geometries this is rather complicated. I have created something that I think is correct but it would be nice to have a way of verify this and I'm thinking about GearPro. When defining a gear or spline in GearPro it will generate a model that can be exported. My question is. Does anyone know whether this model is correct and accurate according to mathematically perfect gears and splines. I have made some tests and with addendum modification set to 0 my attempt and what GearPro produces is more or less indentical. Differences of <0,0001 mm. When I try to use addendum modification GearPro seems to just rotate the basic profile with an amount that will create a correct tooth thickness. Is this the correct thing to do? Of course the root and tid diameters will also change but right now I'm just talking about the complete involute profile. To me this seems a bit to simple compared to everything else regarding gears but I will happily accept it if that is the case 🙂
-
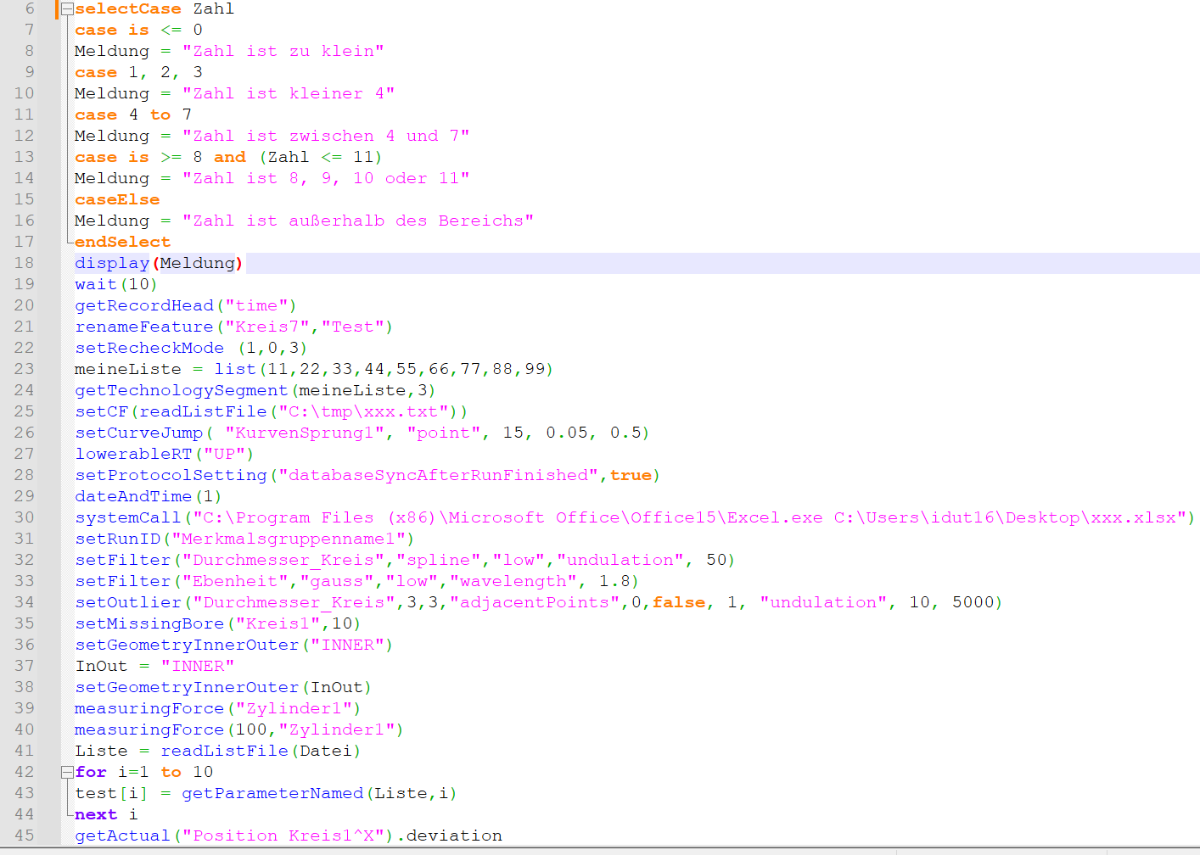
I have a version that recognizes all commands from the function list, comments and operators. As far as I know, using a UDL makes it impossible to recognize a parameter, such as para1=2, so these are still black. CALYPSO-PCM.xml
-
[lo...] joined the community
-
[Am...] joined the community
- Yesterday
-
Glad you sorted out Radial Distance (R), it’s always the 2D projected distance perpendicular to your alignment's primary axis onto the working plane. To batch-change points from Contact to Space/Plane Point without modifying them one by one: select all the features in the element list, then use Prepare > Features > Feature Editor (or Multiple Feature Modification) to update the evaluation type for all selected points at once!
-
[Lu...] joined the community
-
[Fe...] joined the community
- Last week
-
I started doing something similar, then the operators just typed random characters to fill the value. Now I am still looking at a "Black List" of characters and coding it in PCM, or perhaps, if possible, have a script check the values and redirect. And that just gave me an idea. I already have an interface for selecting part numbers, I can transfer the 4 required fields to the interface, remove from Calypso and check values there where it's a lot easier to code in VB.net. I can then call the 4 fields from the para file I generate. Now I have another task.
-
Explain what you mean by wrong. Maybe show a snippet of your code.
-
Edit the "inspset" file, search for the string (Path) in the top image and edit as needed. I would search for "X:\Calypso\QC-Calc Data\History\master Export Files\" Save the file and run the program again. Always have a backup of the file you are editing!
-
Planner still seems to be broken or at least I'm not setting it up correctly and need guidance. When creating a new machine and adding MasterProbe, it still does not work or show at all when attempting the legacy method of importing the MasterProbe SSC.
-
Hello, I have a CAD file with datum point in. These datum points are named in the CAD program and the name is in the retained in the exported STEP file. In the STEP file this is a Cartesian point. See line from the file. I would like to import this point into Calypso and keep the point name in Calypso. It should become a space point. But when I do an import of the Step file in Calypso, the points are showing up as Point1, Point2, Point3, .... and so on. The original point name is not available in Calypso. What are the possible method to import these point with name in Calypso? Implement in the step importer similar as in the Zeiss inspect; Create a import script for these points; Other CAD export format; Other method.
-
You cannot, pratically. Circle surface scanning is too litle. You have to start form a solid calypso allignment starting from Datum A, then scan the cone on two far section, then on charatheristic choose "semi angolo del cono".
-
Zeiss O-Inspect 863: Simple Optical Only Program Runs In Calypso Desktop But Fails In AutoRun
[Mi...] posted a topic in AutoRun
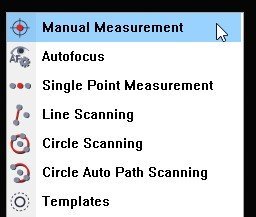
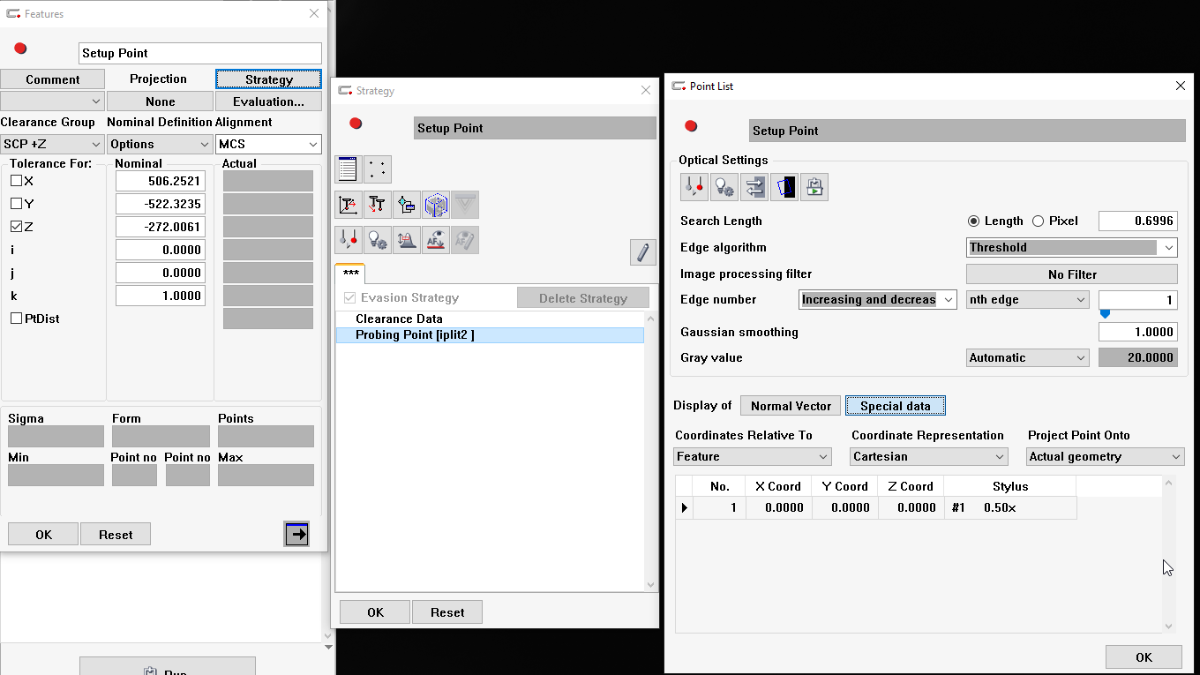
Dear Calypso Users I have a Zeiss O-Inspect 873 where I developed a simple Calypso 2020 program that has 1 optical manual point feature (created by the optical tool “Manual Measurement”). Using a base alignment with no features and an alignment MCS (CMM System), optical sensor at 0.50X, upon execution, the CMM travels in CNC mode to the designated point in the MCS, shows the red crosshairs allowing me to adjust a particular fixture component (micro VBlock) parallel to the horizontal crosshair. When satisfied with the VBlock rotational orientation, I strike the button on top of the right joystick to end the program. This program works beautifully in Calypso desktop. However, when executing it in AutoRun, it was working well, then all of a sudden it stopped working yielding an error message. The CMM optical sensor (0.50X) moves to the proper position; the computer monitor appears to switch to camera live image mode for a brief second, but then switches back to non-live image mode, finally yielding the error message. See attached error report and screen captures. Please see attached screen shots and Error Report. I look forward to your thoughts and insights. Good Weekend Mike Roterdam Senior Metrology Engineer ErrorReport.txt
-
[Pe...] joined the community
-
I'm curious if anyone has ever had getActual(char).toleranceState be flat out incorrect? I'm testing something offline, could it be because of that? Calypso 2025